
Often, numbers tell more than words. For example, when it comes to the volumes of goods being transported by which modes of transport – worldwide, in Europe, and in Germany. We offer you insights into revealing statistics on freight transport. You will discover, among other things, which mode of transport dominates worldwide or whether rail can actually gain market share over road.
Global Freight Transport Statistics: Limited Data
Reliable statistics on the global movement of goods do not exist, simply because many of the roughly 200 countries on our planet do not record sufficient figures.

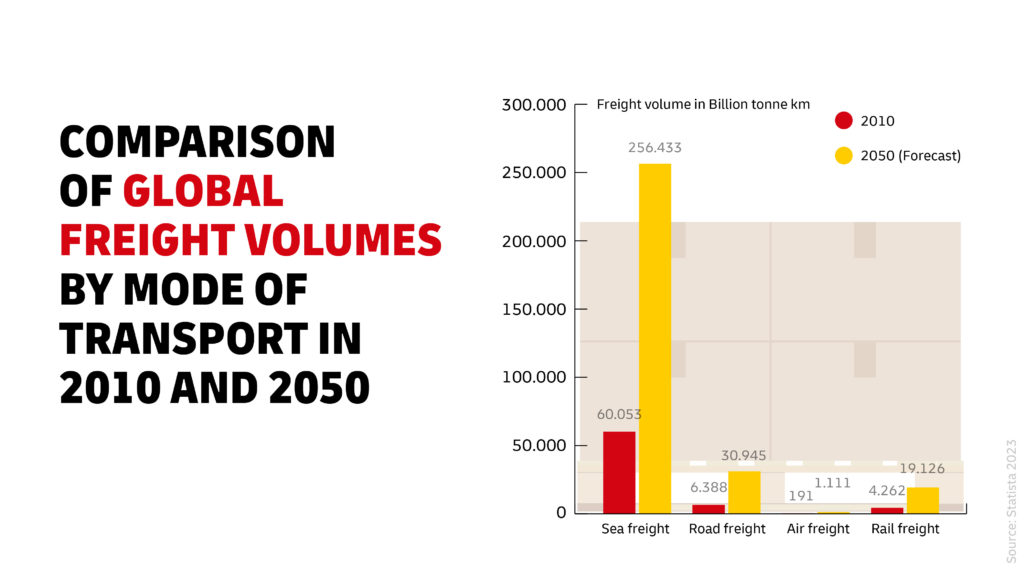
In the long term, high global growth rates are expected for all modes of transport, with ocean freight showing the highest. This perpetuates the current state of global freight transport, with ocean shipping accounting for around 90 percent of global freight traffic. Maritime transport performance was already over 60 trillion tonne-kilometers in 2010, and estimates suggest that it could quadruple by 2050. Global road freight transport is expected to increase even more: from 6.388 trillion tonne-kilometers (2010) to around 30 trillion tonne-kilometers (2050).
There has already been an impressive development in sea freight volumes in the period from 2000 to 2020. In 2000, around 224 million twenty-foot standard containers were being transshipped in ports around the world. In 2019 (before the slight decline to 791.58 million due to the pandemic), the figure was already over 800 million twenty-foot standard containers.
At the same time, air cargo volume has increased from 118 million tonne-kilometers (2000) to 221.5 million tonne-kilometers (2019). This is almost a doubling – although the recent trend has been downward.
Road Freight Statistics
Especially in the road freight sector, reliable data is often lacking. Nevertheless, the 74 member states of the International Transport Forum (ITF) provide precise figures on land freight volumes. In the period from 2010 to 2021, there has been solid growth in transported freight, especially in emerging markets such as India or Uzbekistan – in the case of Kazakhstan, even by around 50 percent. But also Eastern European EU member states such as Poland or Romania are experiencing strong increases, while industrialized nations like Japan, Italy, or Great Britain have recorded declining figures.
Rail Freight Statistics
In the case of rail freight, growth is only moderate even in the fast-emerging economies, which is probably mainly due to the fact that growth in rail infrastructure lags behind growth in demand. This also applies to the absolute figures when comparing road and rail freight transport. In 2017, for example, around 2.5 billion tonne-kilometers were transported by road in India, but only around 650 million by rail.
What Is the Share of Freight Traffic in Total Traffic?
This is a question that cannot be answered properly because it is simply not possible to compare the data that is collected in each case: freight traffic is calculated either in transport volumes (tons) or transport performance (ton-kilometers), and passenger traffic is measured in terms of the number of persons transported or in terms of passenger-kilometers.
Freight Transport in Europe
European Freight Transport: Truck vs. Rail Transportation
In Europe, too, the vast majority of land freight is road-based. In 2021, 13.65 billion tons of goods were transported in the 27 EU states. The latest figures for rail date from 2016, when in the EU, which at that time still comprised 28 states (including the United Kingdom), around 1.7 billion tons of goods were shipped by rail and 14.25 billion tons by road. The figure for inland waterway transport was just under 547,538 tons in 2016 (EU-28) and 522,216 tons in 2021 (EU-27). In 2016 (EU-28), the share of rail in freight transport was less than 15 percent and the share of road freight around 80 percent.

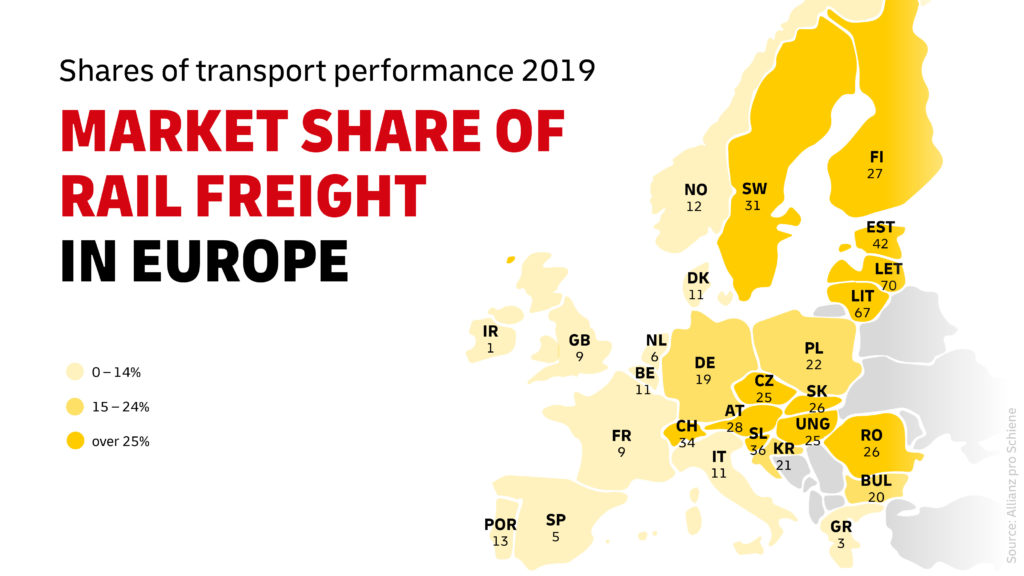
In some EU countries, especially in the northeast of the Union, the share of rail freight in total freight volumes is very high. Latvia is in the lead with an impressive rail share of 70 percent (2019). However, as large economies such as Italy (11 percent) or France (9 percent) have significantly lower shares, the high share of smaller economies is hardly reflected in the statistics.
Statistics on Freight Transport in Germany, Europe’s Largest Economy
Germany more or less reflects the situation in the EU as a whole, with a share of rail slightly above the EU level. In 2021, trucks transported 3.69 billion tons of goods in Germany, freight trains 387.7 million tons, and inland waterways around 195 million tons. Over the past ten years, the volume of goods carried on the roads has thus increased by slightly less than 10 percent (2011: 3.36 billion tons). On the railways, the increase of nearly 4 percent (2011: 374.7 million tons) was less substantial.
Market Shares of Road and Rail
The shares of the two main modes of transport in the total freight volume in Germany in 2021 were 72.2 percent for road freight and 18.7 percent for rail freight. The share of inland waterway transport was 6.9 percent.

Over the past 20 years, rail’s overall share in German freight transport has grown by only 2.5 percent. For the past five years, there has even been stagnation, with rail’s share leveling off around the 19 percent mark. The main obstacle to the (politically desired) increase in the market share of rail freight is the inadequate infrastructure – just as on a global or European scale.
German Road Freight Statistics
So, when it comes to transporting goods overland in Germany, road freight is mostly involved. And road freight will continue to play its part, simply because it is the only option for door-to-door deliveries and a high degree of flexibility – both in terms of time and space.
This importance is evident in the figures of the official road freight statistics of the Federal Motor Transport Authority (“Kraftfahrt-Bundesamt”, KBA) for the year 2021. These show that 256 million rides were made by trucks in Germany, covering a total of 22.973 billion kilometers. There is potential for optimization, above all in empty runs. There were a total of 154.7 million of these in 2021. A remarkable 6,776.6 billion empty vehicle kilometers were covered: that means that around 30 percent of all runs were empty runs.
How to Interpret Freight Statistics Correctly
Statistics are no end in themselves but indicate where there is a need for action. DHL Freight, for example, aims to avoid empty runs with digital tools for smart route planning and to reduce the total volume of runs with software applications for load optimization. For the sake of sustainability, DHL Freight also intends to expand intermodal transport concepts that include rail freight and to increase the overall internal rail share – but this requires the necessary infrastructure.