Global air freight demand grew steadily in the third quarter of 2026, but the trade lanes driving this growth shifted fundamentally. This update summarizes developments from July to September and assesses which of them will carry over into the fourth quarter.
Key takeaways
- Demand: Up 5% year-on-year and year-to-date, with a clear shift between trade lanes.
- Trade lane shift: Asia-Europe dropped by 8% in August, while Asia-North America recorded double-digit growth for the fifth consecutive month.
- Capacity: From unchanged in August to up 3% in September, driven primarily by freighters.
- Rates: USD 3.04 per kilogram in calendar week 38, 24% above the previous year.
- Jet fuel: USD 183 per barrel at the end of September, more than twice as much as a year earlier.
How did demand develop in the third quarter?
The overall figure masks the real development. Volume growth was 5% year-on-year in both July and August, exactly in line with the year-to-date level. Beneath that headline figure, however, the air freight market landscape changed noticeably.
The underlying demand data extends through the end of August.
Which trade lanes are driving growth?
Growth is increasingly concentrated on the transpacific and on trade lanes beyond the traditional major routes. It is being driven by AI infrastructure, semiconductors and technology-related manufacturing.
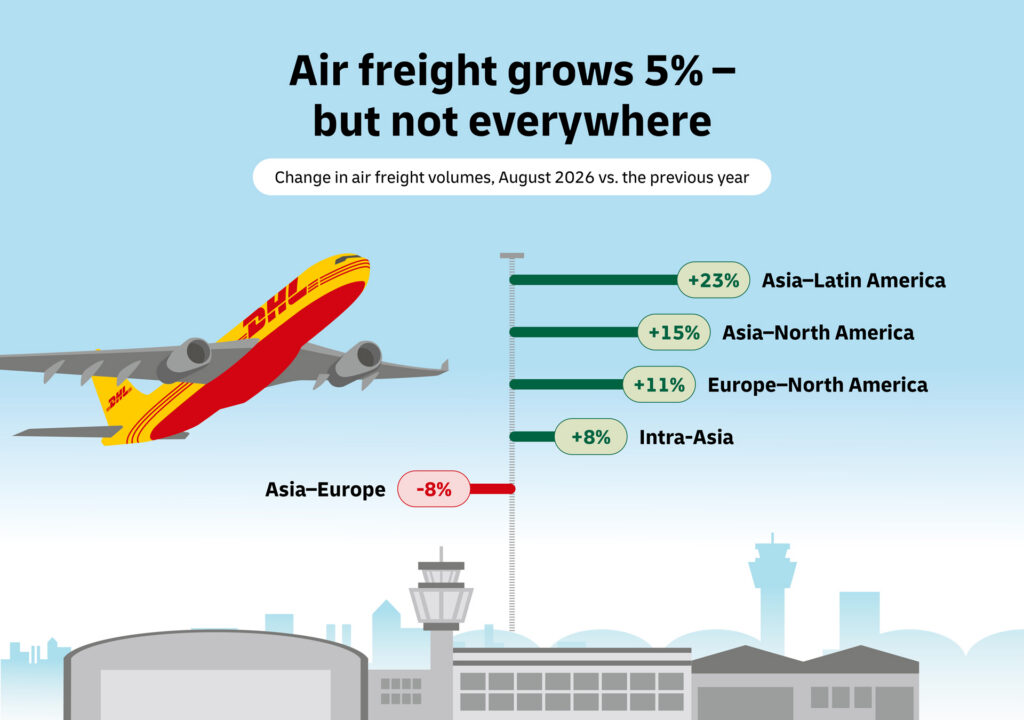
| Trade lane | Change in August vs. previous year |
| Asia-Latin America | +23 % |
| Asia-North America | +15 % |
| Europe-North America | +11 % |
| Intra-Asia | +8 % |
| Asia-Europe | −8 % |
| Middle East and Africa | −4 % |
Particularly striking is the breadth of Asian export momentum toward the US: Korea grew by 54%, India by 27%, Singapore by 22%, Japan by 20% and China by 16%. Within Asia, individual lanes grew even more strongly, including Singapore-China by 77% and Japan-Taiwan by 40%. Double-digit growth on Europe-North America gives the market a source of growth outside Asian trade lanes for the first time in some time.
Why is Asia-Europe declining?
The decline is not due to a collapse in industrial demand, but to a regulatory turning point. The new EU import rules have structurally weakened e-commerce flows from Asia following the removal of the duty-free threshold.
The extent of the shift varies across destination markets. Combined volumes from China and Hong Kong to Spain fell by 43% in August, to Belgium by 35% and to France by 26% year-on-year.
For shippers, this has a positive side effect: main-deck capacity is once again available on these routes after previously being occupied by e-commerce.
How did capacity develop?
Capacity showed the clearest movement during the quarter. In August, it remained unchanged year-on-year; in September, it grew by 3%. The increase was driven by freighters, up 4%, while belly capacity on passenger aircraft rose by 2%.
Where is capacity shifting?
The shift from Europe-related traffic to the transpacific, which characterized the quarter, continued in September. Capacity on Asia-North America grew by 11%, and freighter capacity by as much as 13%.
Asia-Europe presents a mixed picture:
- Freighter capacity: still 3% below the previous year, but already up 5% month-on-month
- Belly capacity: 16% above the previous year; here, the market is replacing main-deck capacity with belly capacity
The Middle East and Africa is the only region with declining capacity, down 3% in September. The shortfall is concentrated on the Europe corridor. By contrast, the recovery in the Gulf region continues: capacity there has increased by 18% since calendar week 9, although rates remain 44% above the level at that time.
How did air freight rates develop?
Rates moved upward over the course of the quarter and most recently stabilized at a high level. In calendar week 38, they stood at USD 3.04 per kilogram, 24% above the previous year. At the end of August, in calendar week 34, they were still at USD 2.98. Spot rates reached USD 3.45 per kilogram, up 33% year-on-year.
Notably, rates have recently moved sideways despite the sharp rise in jet fuel prices. This suggests that the additional capacity in September has, for the time being, absorbed the cost pressure.
Year-on-year increases vary considerably by region:
| Region | Spot rates in CW 38 vs. previous year |
| Middle East and South Asia | +52 % |
| North America | +34 % |
| Africa | +31 % |
| Asia-Pacific | +30 % |
| Europe | +29 % |
Rates on trade lanes out of Asia-Pacific remained firm: USD 4.72 per kilogram to Europe and USD 6.75 per kilogram to the US, 40% above the previous year.
Why are fuel costs rising so sharply?
Fuel costs were the cost component showing the strongest movement in the third quarter. Jet fuel cost USD 183 per barrel at the end of September, 109% more than a year earlier. Crude oil stood at USD 117 per barrel, after an interim high of USD 124 in mid-September and around 24% above the level in mid-August.
The cause is renewed geopolitical disruption in the Middle East. Supply remains tight: European ARA inventories of jet fuel have fallen to their lowest level in seven years, increasing dependence on Asian imports.
Pre-carriage and onward transport are also becoming significantly more expensive. US diesel prices exceeded USD 200 per barrel in early September, 94% above the pre-crisis level. Disruptions to product exports from the Gulf region and Russia have further tightened global diesel availability.
Which regulatory developments are relevant?
Four developments from the third quarter have a direct impact on planning:
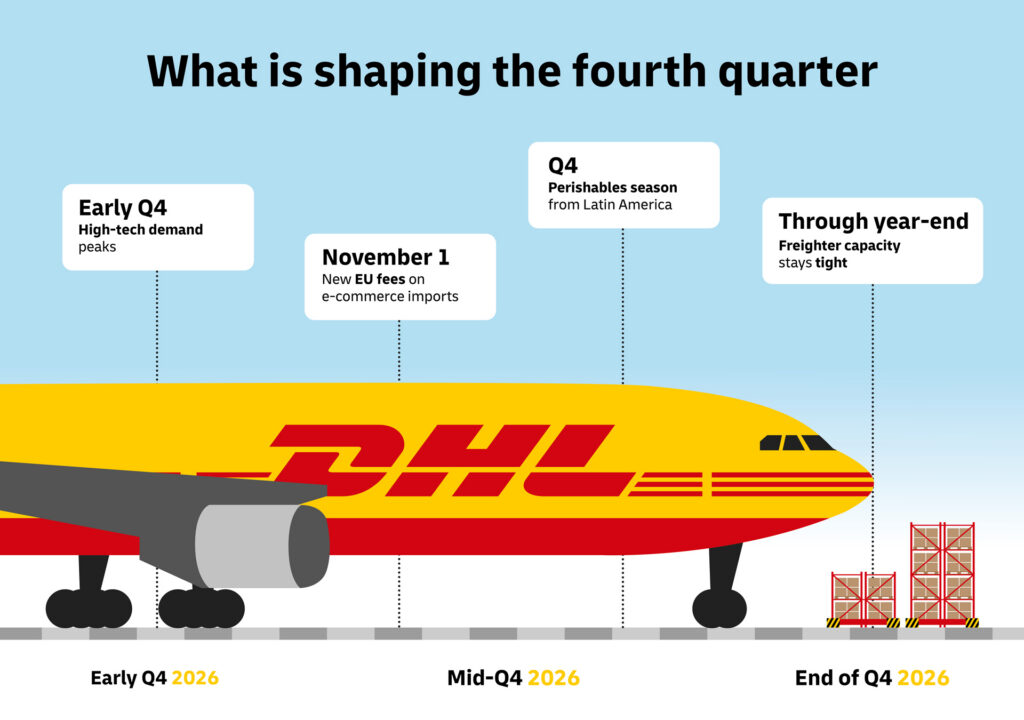
- EU e-commerce: From November 1, imports will be subject to a EUR 2 handling fee, in addition to the EUR 3 customs charge introduced in July. Product identifiers will also become mandatory. This will further increase pressure on cross-border e-commerce flows.
- Dangerous goods: On September 24, IATA called for a coordinated, supply-chain-wide approach to undeclared or misdeclared dangerous goods. Around 80% of reported dangerous goods incidents in the first half of 2025 involved undeclared or concealed shipments.
- Sustainable aviation fuels: On September 17, EASA published the ReFuelEU annual report. SAF accounted for 2.8% of total aviation fuel in the EU in 2025, above the mandatory 2% quota. Volumes increased to around 1.1 million tonnes.
- Canada: Since September 8, new tariffs have applied to US imports worth around USD 28 billion.
How does the situation differ by region?
No market is currently moving in step with the global average. The following overview summarizes the key factors shaping each region.
| Region | Situation in the third quarter |
| Europe | Overall market stable; EU customs measures continue to dampen e-commerce volumes from China, freeing up capacity. Airlines have responded by reducing freighter capacity and stabilizing rates. Capacity may tighten again ahead of the year-end peak. |
| Asien | Outbound demand in August was up 6%, while capacity grew by only 2%; the market remains tight. Growth is being driven by North America, up 15%, and Latin America, up 23%. Outbound rates are 24% above the previous year. |
| Middle East and Africa | Networks have largely stabilized following the earlier airspace disruptions, although diversion routes remain in operation. Capacity on several Gulf routes remains tighter than before the crisis. |
| North America | The transpacific is stable overall, supported by high-tech and data-center goods from Taiwan, Vietnam, Indonesia, India and Singapore. The transatlantic is stable to slightly positive, driven by pharmaceuticals, aviation, automotive and high-value technology. |
| Latin America | Capacity to Asia is stable, while capacity within the region and to North America and Europe is tight. The berry season is beginning, creating volume potential to Europe, Asia, the Middle East and Africa. |
One detail with broader significance: total volumes to Latin America fell by 3% year-to-date through July, led by Chile at minus 10%, Brazil at minus 9% and Colombia at minus 8%. Temperature-controlled freight grew by 30% over the same period.
What can be expected in the fourth quarter of 2026?
On the demand side, several factors point to a strong final quarter. High-tech demand is expected to peak at the beginning of the fourth quarter, driven by new devices, consumer electronics and the Christmas season. This is complemented by seasonal demand for perishables, particularly from Latin America to North America.
On the capacity side, the situation is tighter than September's growth suggests:
- Freighter availability is becoming a bottleneck: The market has to absorb the loss of seven contracted 767 freighters from September, while ongoing delivery delays at Boeing are limiting the supply of additional main-deck capacity.
- Growth is concentrated on Asia-North America: AI, semiconductor and electronics shipments are keeping utilization high there, and airlines have already allocated their planned peak capacity to the transpacific.
The key risks remain geopolitical. Rising tensions around the Strait of Hormuz and the Red Sea are keeping fuel surcharges, insurance premiums and rerouting costs high. Continued uncertainty over tariffs, technology restrictions and US-China relations could affect semiconductor, electronics and automotive flows in the fourth quarter.
How should you plan for the fourth quarter?
Six concrete implications can be drawn from developments in the third quarter:
- Book transpacific shipments early: Although capacity is growing, it is being largely absorbed by AI and semiconductor traffic, and airlines have already allocated their peak capacity there.
- Plan for the EU e-commerce rules effective November 1: The handling fee, customs charge and mandatory product identifiers will change the cost calculation and data requirements for cross-border shipments.
- Reassess Asia-Europe: Belly capacity is 16% above the previous year and freighter capacity is recovering. However, this could reverse again ahead of the year-end peak.
- Reflect fuel surcharges in the budget: Jet fuel is more than twice as high as a year ago, and diesel prices are adding further cost to pre-carriage and onward transport.
- Review dangerous goods declarations internally: The share of undeclared or misdeclared shipments among reported incidents is high, and the level of scrutiny is likely to increase.
- Replan Argentina traffic: Ezeiza Airport in Buenos Aires is closed from October 26 to November 11 for maintenance work.
The monthly DHL Air Freight Market Update
Would you like the full figures for your trade lane? DHL's monthly Air Freight Market Update provides detailed analyses of demand, capacity, rates and fuel developments by region.
Conclusion: What are the key takeaways from the third quarter?
The 5% volume growth is the least remarkable figure of the quarter, and the most misleading. Behind it lies a redistribution of cargo flows: the transpacific and secondary trade lanes are growing at double-digit rates, while Asia-Europe is shrinking under the new EU import rules.
Capacity is following this shift rather than offsetting it. Main-deck capacity is moving to where the volumes are, while the freighter fleet is growing more slowly than demand would require. At the same time, jet fuel prices have more than doubled within a year without this having been fully reflected in rates so far.
For the fourth quarter, this means booking earlier on high-demand trade lanes, preparing for the new EU rules from November 1 and budgeting fuel costs realistically. Contact us if you would like to review your trade lanes before the end of the year.
All fuel prices and figures referenced in this article are based on data from the U.S. Energy Information Administration (EIA).
FAQs about the Air Freight Market Update
How strongly did air freight demand grow in the third quarter of 2026?
Global air freight demand grew by 5% year-on-year in both July and August, matching the year-to-date rate. Growth was distributed very unevenly, however: Asia-North America increased by 15% in August and Asia-Latin America by 23%, while Asia-Europe declined by 8%.
Why is air freight between Asia and Europe declining?
The cause is the new EU import rules, which have structurally weakened e-commerce flows from Asia. Combined volumes from China and Hong Kong to Spain fell by 43% in August, to Belgium by 35% and to France by 26%. As a result, main-deck capacity is becoming available again on these routes.
How did air freight rates develop?
In calendar week 38, global air freight rates stood at USD 3.04 per kilogram, 24% above the previous year. Spot rates reached USD 3.45 per kilogram, an increase of 33%. The strongest year-on-year increases were recorded in the Middle East and South Asia at 52%, and North America at 34%.
How sharply have jet fuel prices increased?
Jet fuel cost USD 183 per barrel at the end of September, 109% more than a year earlier. Crude oil stood at USD 117 per barrel after an interim high of USD 124 in mid-September. European jet fuel inventories have fallen to their lowest level in seven years.
What changes for EU imports on November 1, 2026?
E-commerce imports into the EU will be subject to a EUR 2 handling fee in addition to the EUR 3 customs charge introduced in July. Product identifiers will also become mandatory. Both measures increase pressure on cross-border e-commerce flows and should be reflected in cost calculations and data processes.