A high OTIF score indicates that orders are delivered on time and in accordance with the agreed terms. This supply chain KPI is therefore crucial for transport companies, as it indicates the provision of high-quality logistics services, thereby increasing customer satisfaction. What exactly does OTIF mean, how is the score calculated, and how can it be improved?
What is OTIF?
Delivery reliability and accuracy are essential quality indicators for logistics services. OTIF is a performance metric used in supply chain management to evaluate these two factors. Thus, the OTIF metric is an indicator of delivery reliability. This makes OTIF a very important KPI for transport logistics.
OTIF enables transport companies to evaluate their delivery accuracy and allows clients to assess the quality of their logistics partners’ services.
Indicators for Success: What are KPIs in Logistics?
In every industry, there are indicators that can be used to quantify the success of a company and to implement ...

OTIF: Meaning, Definition, and Parameters
The two components of the term “OTIF” – “on time” and “in full” – are self-explanatory: OTIF reveals whether a delivery is carried out within the specified timeframe and in the agreed quantity. In addition, two further criteria must be met to achieve a high OTIF score.
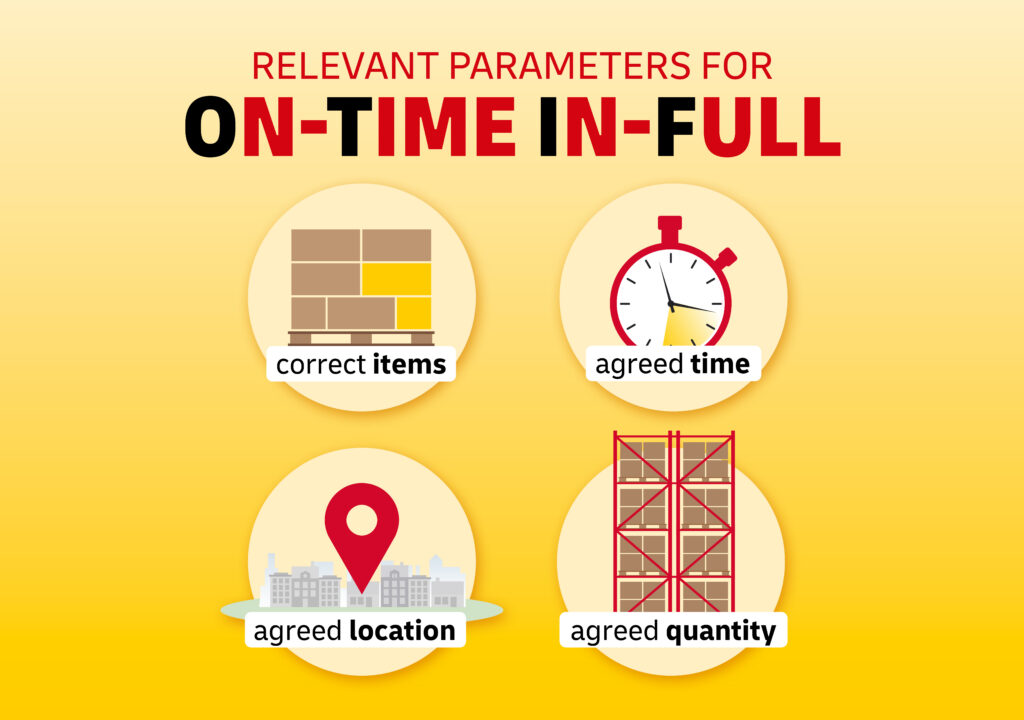
Overview of OTIF-relevant parameters:
- The delivery includes the correct items.
- The delivery corresponds to the agreed quantity.
- The delivery arrives at the agreed time.
- The delivery arrives at the agreed location.
On-Time In-Full Calculation: This Is How It Works
The formula for the OTIF indicator is:
OTIF (in %) = (number of complete and on-time deliveries ÷ total number of deliveries) x 100
To determine improvements and deteriorations in delivery quality on a timeline, it is useful to calculate the change over a specific period of time.
A logistics service provider that carries out 120 goods transports for a company within a month, twelve of which do not meet the OTIF criteria, achieves an OTIF score of 90 percent: (108 ÷ 120) x 100 = 90%
Refined Formula for the OTIF KPI
It is also possible to break down the calculation according to the main criteria of “on time” and “in full”. In this case, the formula is:
OTIF (in %) = ([number of complete deliveries ÷ total number of deliveries] x [number of on-time deliveries ÷ total number of deliveries]) x 100
A logistics service provider that carries out 120 goods transports for a company within a month, four of which are incomplete and eight of which are late, also achieves an OTIF score of 90 percent according to this calculation: ([116 ÷ 120] x [112 ÷ 120]) x 100 = 90%
What Is Considered a Good On-Time In-Full KPI?
While one hundred percent may be the ideal, it is clearly unrealistic: not every delivery can be on time and complete. Supply chains depend on too many internal and external factors for this to be feasible. The list of influencing factors is long: high sickness rates, accidents, storms, traffic jams, political conflicts in producing countries, changes in import regulations, and so on. Despite the efforts of logistics companies to make supply chains as resilient as possible, achieving a figure of one hundred percent is almost impossible.
OTIF scores of 95 per cent or higher are generally considered to be proof of a highly resilient supply chain and high-quality deliveries. Conversely, scores below 85 percent indicate that service providers are operating below acceptable levels. This suggests a lack of efficiency.
What Does OTIF Delivery Entail for Contracting Companies and Transport Service Providers?
OTIF calculations offer practical advantages to logistics providers and their clients alike. OTIF provides both parties with a tool for identifying their own strengths and weaknesses or for directly comparing service providers.
Benefits for Contracting Companies
To remain competitive and meet customer expectations, companies must have reliable inventory management and deliveries. If deliveries are carefully documented, companies can use OTIF analyses to objectively record and compare the delivery quality of different transport providers.
Partnering with a transport logistics provider that excels in key performance indicators can help companies improve inventory management, efficiency, customer satisfaction, and competitiveness. This is precisely what Walmart aimed to achieve when it introduced OTIF for its suppliers in 2017, gradually raising the requirements from 75 percent to over 90 percent in subsequent years. Walmart ensures that its shelves are always stocked and that items are available whenever customers want them.
Benefits for Transport Logistics Providers
Calculating OTIF scores helps transport service providers identify operational deficiencies. OTIF KPIs can be collected for different types of transportation, goods, or companies supplied. This allows service providers to quickly determine which processes are running smoothly and which need improvement, such as choosing more resilient routes or selecting alternative producers.
On-Time In-Full Scores Are Limited in Informative Value
OTIF only partially reflects the complexity of supply chains. For example, the mere indicator says nothing about who is responsible for poor delivery quality. It makes a difference whether the KPI is lowered due to internal inefficiencies at the service provider or extreme weather events that affect all market participants. Therefore, companies should put the figures into context to correctly assess them.
Also, the OTIF score does not indicate how long a delivery has been delayed. Whether the delay is two hours or two days matters significantly. To make a reliable statement about delivery quality, it is important to link OTIF data with additional information.
Which Other Key Figures Complement OTIF’s Reliability?
OTIF does not account for a factor that is undoubtedly relevant to clients: transportation costs. Nonetheless, it is crucial for manufacturers or retailers to know how transport costs relate to sales and what percentage of a product’s total price is accounted for by transport costs. There is a specific KPI for this, and calculating it makes the transport-price ratio transparent.
Only in combination with this and other logistics KPIs does OTIF become a truly reliable tool. For shippers, for example, the supplier compliance ratio is also likely to be informative. It not only shows how efficiently and reliably the service provider works, but also whether delivery security is guaranteed. As with OTIF, this key figure can also be used to compare different service providers.
How Can the OTIF Score Be Improved?
Companies without their own transport and warehouse logistics, or those with limited resources, can primarily improve their OTF score by working with a competent logistics partner. That said, cooperation should not be terminated immediately in the event of minor problems. In some cases, clear and early communication between logistics service providers and shipping companies may be sufficient to optimize processes.
In today’s world, communication also involves interfaces between management systems used by shippers, service providers, and recipients. This ensures a seamless flow of information and complete transparency across the entire supply chain.
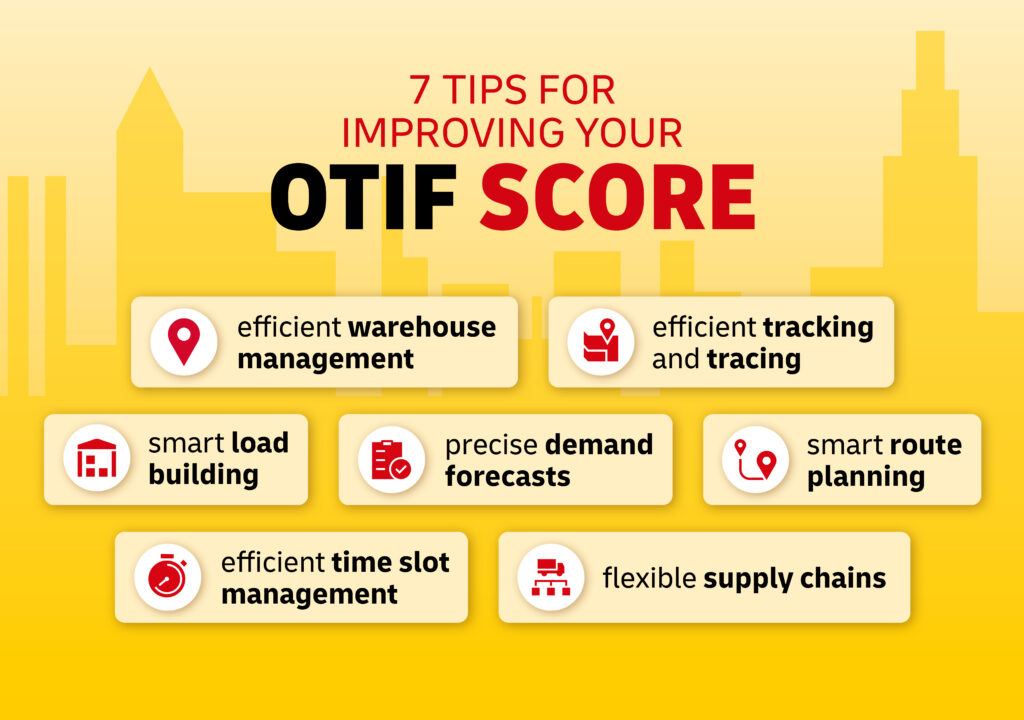
Further targeted measures to raise the OTIF KPI for companies with in-house logistics and for logistics service providers include the following:
- Efficient warehouse management: This includes highly automated processes for incoming and outgoing goods that are fast and error-free.
- Efficient time slot management to ensure smooth truck loading and unloading processes
- Smart load building: This optimizes the use of loading space, reduces errors, and accelerates delivery processes.
- Smart route planning: This ensures that all recipient companies along the route receive their deliveries as punctually as possible.
- Efficient tracking and tracing: This allows delivery processes to be managed more reliably.
- Flexible supply chains that can switch to other suppliers, modes of transport, or routes. Flexible supply chains are resilient, making it easier to meet deadlines and increase the availability of in-demand goods.
- Better and more effective use of capacities through precise demand forecasts. The quality of forecasts improves with a high degree of digitization and AI applications. Reliable forecasts ensure that quantity and timing commitments can be met.
Conclusion: An OTIF Analysis Benefits Clients and Logistics Service Providers.
The OTIF score alone does not provide a full picture of a service provider’s delivery quality in transport logistics. However, analyzing the OTIF criteria provides valuable insights into efficient and competitive logistics services. After all, customer satisfaction increases when orders are delivered completely and on time as agreed.
The best way to achieve a high OTIF KPI is to streamline processes throughout the entire supply chain. This requires forward-looking demand planning, reliable forecasts, and smart management systems, as well as efficient routes and loads. Effective communication, networking, and automation reduce the error rate, increasing delivery accuracy and reliability.
At DHL Freight, we stand for excellent delivery quality. To maintain this level, our processes undergo continuous quality control. This guarantees that your goods will reach their destination quickly, completely, and sustainably, both now and in the future.