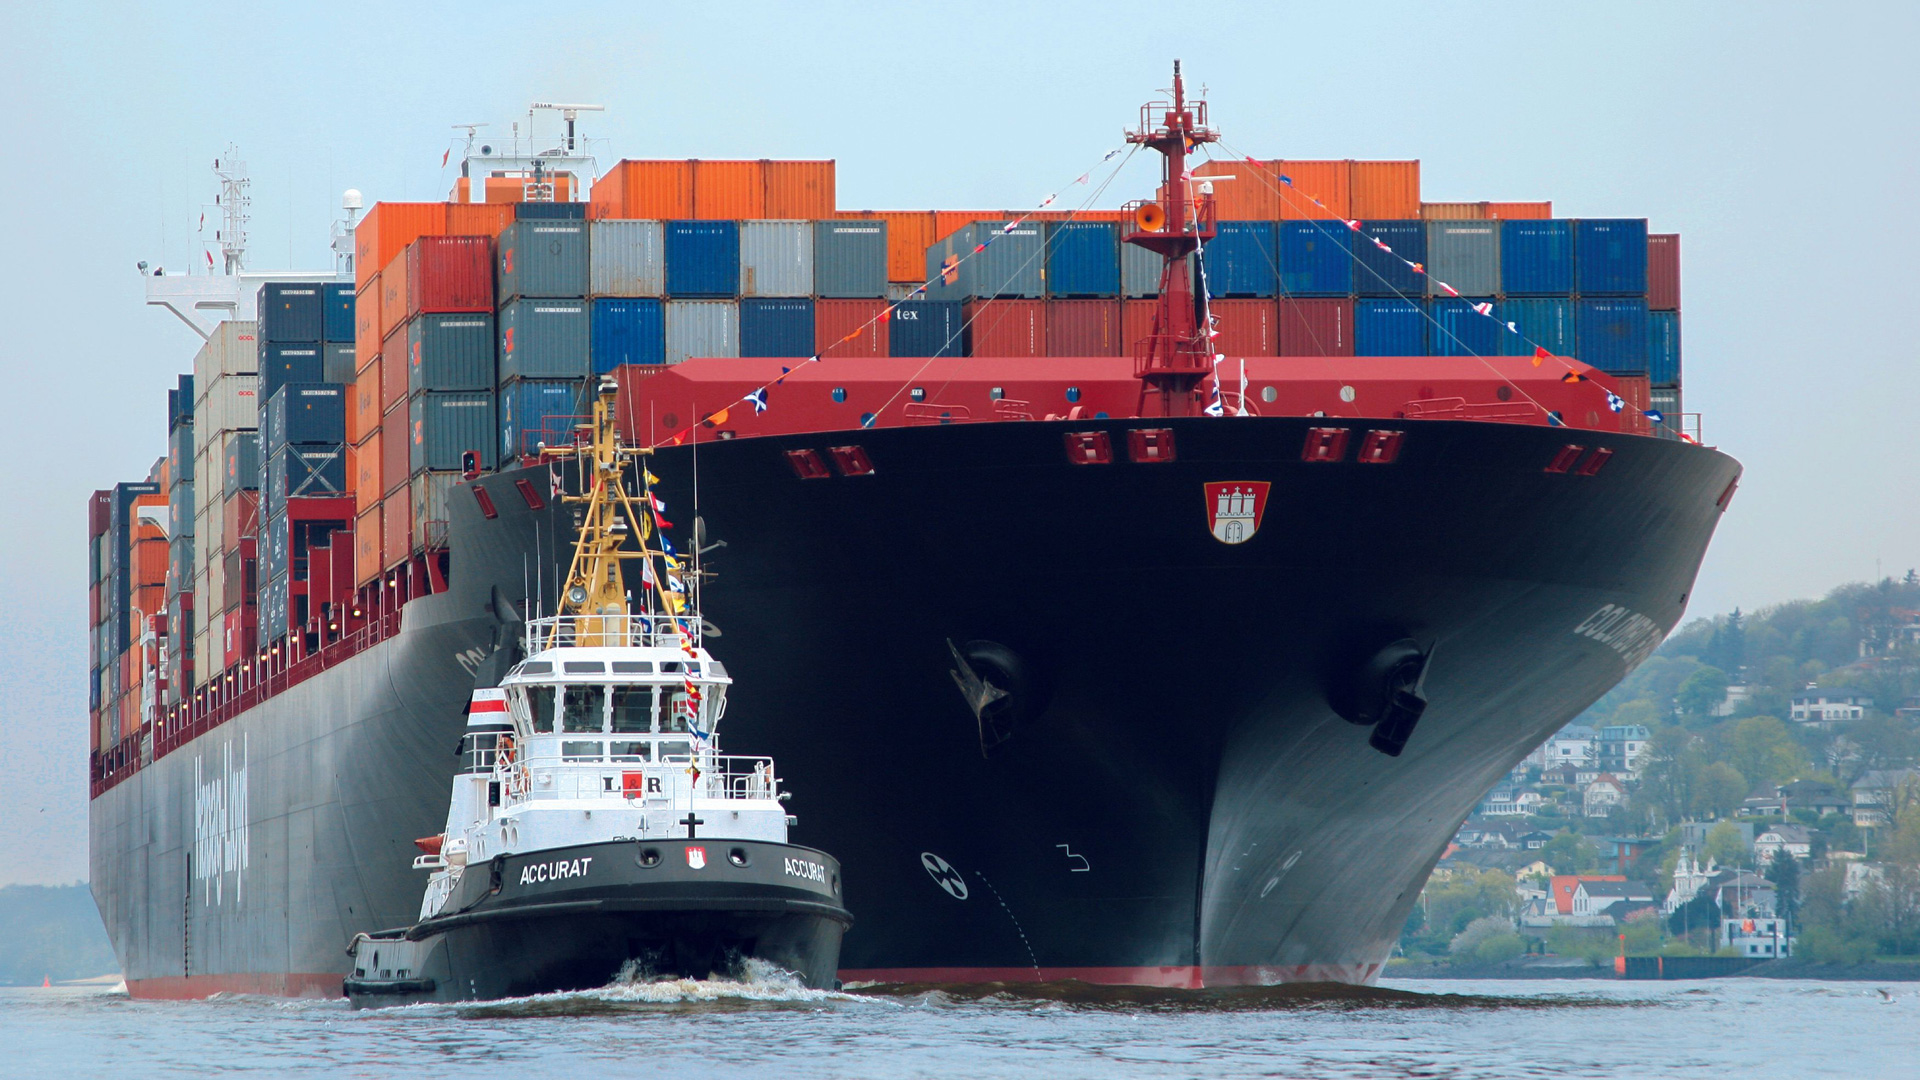
The third quarter of 2026 saw the peak season reach its height, while schedule adherence fell to its lowest level since 2022. This update summarizes developments from July through September and identifies which ones will carry over into the fourth quarter.
Key takeaways at a glance
- Demand: up 5% so far this year, driven by a 9% rise in Asian exports.
- Port gridlocks: a total of 3.8 million TEUs were recently stranded in congested ports worldwide, primarily due to typhoons that hit Chinese ports in July and August.
- Schedule adherence: lowest level since 2022; in Asia, fewer than one in three ships arrived on time.
- Rates: in September, the Shanghai Containerized Freight Index was 231% higher than in the same month the previous year and 44% higher than in June.
- Suez Canal: the return of traffic accelerated significantly, growing from 3% of total East-West traffic in February to approximately 30%.
How did demand develop during the third quarter?
Demand proved to be remarkably resilient in Q3. The peak season was more intense than expected and extended further into late summer. Though demand is now easing, it remains high.
Global demand for container shipping has risen 5% so far this year, up 5% from the same period last year. Asian exports remain the key driver, with a 9% increase. The underlying market data includes shipments up to the end of July.
Two trends are shaping the current situation:
- Traffic in the head-haul direction is growing, but return traffic is not. On the Far East-Europe route, growth in the head-haul direction has been 11% so far this year, while growth in the opposite direction is at 0%. This increases the demand for empty container returns and ties up capacity lacking on the head-haul routes.
- Rather than shrinking, trade is shifting. Asian exports are growing particularly strongly on secondary routes. Tariffs do not stop the flow of goods; they redirect it.
Why are port gridlock levels at a record high?
Recently, 3.8 million TEUs were stranded in congested ports worldwide. This number is equal to the peak reached during the 2022 pandemic, but the percentage of the global fleet affected remains below that year’s level. Unlike in 2022, the current gridlocks are concentrated in Asia rather than spread out globally. We will discuss the reasons for these port gridlocks below.
What caused the congestion?
The cause was the weather, coupled with high demand during the peak season. Several typhoons shut down central Chinese ports for several days at a time in July and August. Only 12% of ships arrived on schedule in Shanghai in August. The resulting backlogs have since spread throughout global networks.
The situation varies greatly from region to region:
| Region | Situation |
| China | Port closures lasting several days due to typhoons, massive backlogs with a global ripple effect |
| Indian Subcontinent | Transshipment ports such as Nhava Sheva are handling additional volumes that previously passed through the Middle East; delayed arrivals from Asia are leading to a shortage of empty containers |
| Northern Europe | High yard utilization amid tight capacity, exacerbated by limited inland waterway transport due to low water levels on the Rhine; furthermore, the port of Hamburg faced the threat of a strike |
| Middle east | Geopolitical disruptions continue to affect the routing of ships |
Why is the land side the main bottleneck?
Congestion extends beyond the dock. Overloaded terminals and inadequate hinterland connections can delay the delivery of goods, even when ships arrive on time. Currently, one of the most effective alternatives is choosing a different regional gateway that aligns with one’s own land transport options.
The problem is structural and cannot be solved by adding more ships. More ships do not create more capacity at terminals, container yards, or hinterland connections via truck, rail, or inland waterways. Thus, the land side remains the defining bottleneck for demand growth in 2027 and beyond.
To what extent has adherence to the schedule decreased?
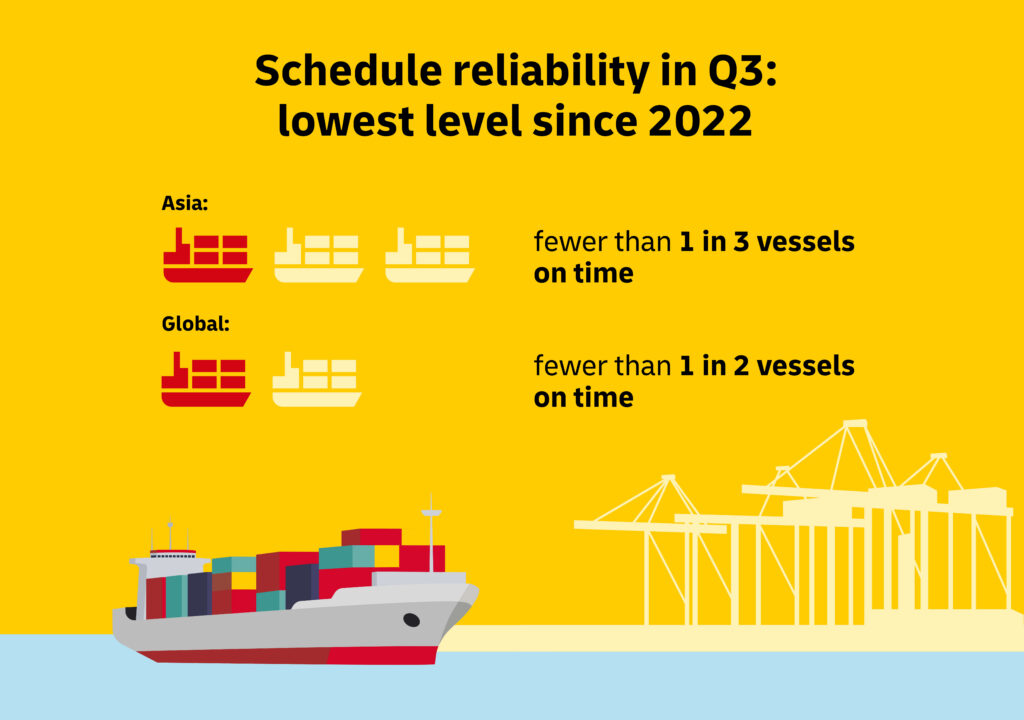
Schedule adherence fell to its lowest level since 2022 in the third quarter. In Asia, fewer than one in three ships arrived on time, and globally, fewer than half did. This not only affects the percentage of on-time arrivals, but also the duration of delays.
Disruptions in Asia are impacting nearly all global shipping routes, including return trips, as ships are departing from Asia late. It is expected to take four to six months to clear the backlog, extending into Q1 of 2027. By then, it will overlap with the next seasonal surge in volume.
For planning purposes, this means that published punctuality rates are currently of only limited use as a basis. The actual reliability of an individual shipment is often lower than these figures because of canceled departures, skipped port calls, waiting times for feeder services, schedule changes, and postponed cargo.
What is the status of the return to the Suez Canal?
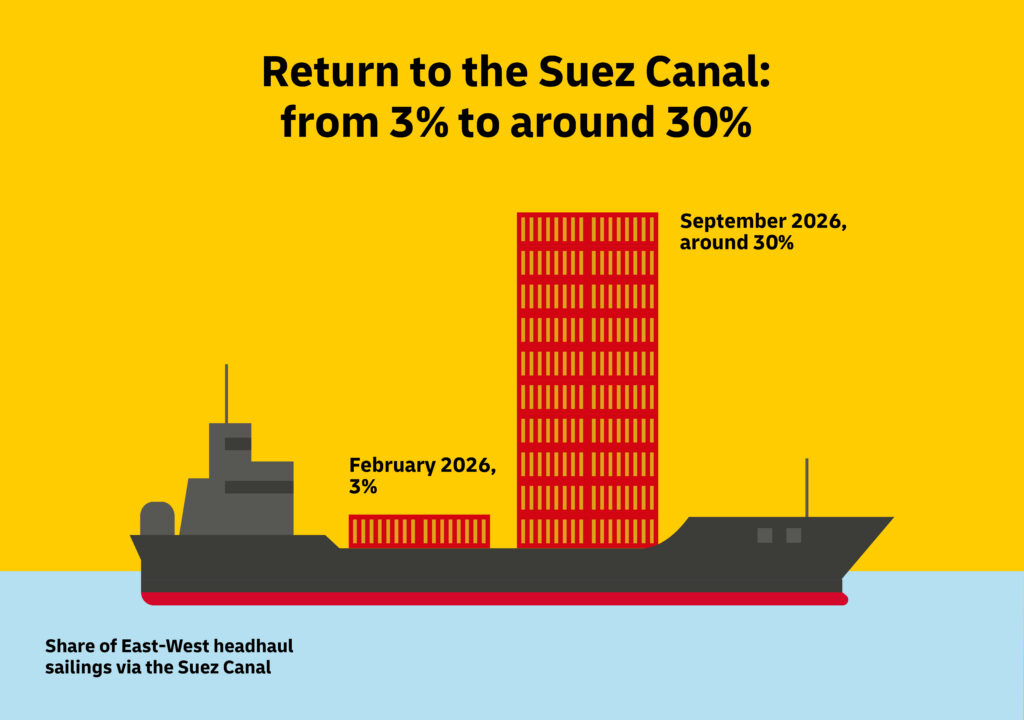
The return to the Suez Canal accelerated significantly in the third quarter. Currently, approximately 30% of all major east-west traffic is scheduled to use this route, up from 3% in February 2026. For Asia-Europe services, this figure is 37% in the head-haul direction and 50% in the back-haul direction.
Two developments have driven this trend. First, the security situation in the Middle East has remained stable, and second, the rise in oil prices has made sailing around Africa significantly more expensive than passing through the Canal.
How do shipping routes and trading areas differ?
The extent of the shift back depends heavily on the destination. The shift is most advanced on Mediterranean routes. For destinations in Northern Europe, however, the majority of ships continue to sail around the Cape of Good Hope.
| Shipping route | Main route via Suez | Opposite direction via Suez |
| Asia–Northern Europe | 25% | 41% |
| Asia–Mediterranean | 56% | 64% |
In the medium term, the Suez route offers several advantages: shorter transit times between Asia, Europe, and the Mediterranean region; lower fuel consumption and, consequently, lower CO₂ emissions per shipment; and an alternative to the Panama Canal for select Asia-North America trade routes.
What should shippers currently consider?
In the short term, uncertainty prevails. Shipping companies make the choice of route, and there have been instances where ships were rerouted during the course of a voyage without prior notice. Any change affects transit time. In terms of price, the route currently offers no advantage. The Suez and Cape routes are generally offered at comparable freight rates:
Because ship arrival patterns sometimes overlap, additional congestion and equipment imbalances are already evident at transshipment and gateway ports. A full return to normal is not expected for another six to twelve months, assuming there are no new security-related incidents.
Before shipping via the Red Sea, you should review your cargo insurance.
Five questions need to be answered:
- Is the cargo insured for its full value throughout the entire route?
- Does the policy explicitly cover transit through the Red Sea and war-related risks?
- Does the policy cover general average and salvage costs, even if the cargo is undamaged?
- Does the insurance remain in effect if the shipping line reroutes the vessel?
- Is the insurance cover note provided before the vessel departs?
How have rates and capacity evolved?
Traffic volumes and capacity diverged in the third quarter: traffic volumes more than tripled compared to last year, but available capacity was limited due to congestion and detours. These two factors will determine how much leeway the fourth quarter offers.
How have ocean freight rates developed?
In September 2026, the Shanghai Containerized Freight Index increased 231% from the same month the previous year and was 44% higher than in June, when the peak season started. Despite the peak season winding down, rates have risen due to ongoing congestion in Asia putting pressure on capacity.
This trend varies depending on the shipping route:
| Shipping route | Situation in the third quarter | Outlook for Q4 |
| Trans-Pacific Eastbound (TPEB) | Summer peak is winding down; rates are stabilizing at a high level | A decline is expected; backlogs are limiting the seasonal decrease |
| Far East Westbound (FEWB) | Rates remain elevated despite a temporary decline | Upward trend reversal expected, despite a gradual return to Suez |
| Asia–Latin America | Volatile, capacity utilization over 98% | Seasonal decrease is offset by high demand |
The FEWB projection is the counterintuitive aspect here. Despite the increased capacity due to the return of the Suez route, rates are expected to rise because demand remains high and the ports on either end of the route are congested.
Why is available capacity still tight?
In terms of nominal growth, the global fleet is expected to expand by approximately 4% in 2026, which is less than the average growth of about 6% over the past ten years and significantly less than the growth of 7% in 2025. However, the crucial factor is not the nominal capacity, but the effectively usable capacity. Currently, it is just under 20% below the nominal figure.
Three factors reduce capacity simultaneously:
- Port gridlocks: by far the largest single factor, most recently 3.8 million TEU
- Detours: A significant portion of the Asia-Europe services continue to navigate around the Cape of Good Hope. As a result, each round trip takes longer and ties up shipping capacity.
- Laid-up tonnage: Ships that are not in service are also not available to meet demand.
Significant additions to the fleet will not enter the market until 2027. That said, this does not automatically mean there will be a noticeable reduction in pressure because the land-based restrictions will remain in place.
What is the cost of fuel and surcharges?
Bunker prices were the most volatile cost component in the third quarter. The volatility this year is unprecedented in the past decade and is directly impacting surcharge structures.
How have bunker prices developed?
The price of Very Low Sulphur Fuel Oil is currently 58% higher than at the end of February 2026. Although oil prices have recently remained relatively stable at this elevated level, geopolitical uncertainty persists. The Strait of Hormuz is effectively closed to regular commercial traffic, the Houthis have threatened Saudi oil exports, and talks between the U.S. and Iran are making little progress. Therefore, oil prices are likely to remain high throughout 2026.
Pre- and post-carriage costs are also rising. Since December 2025, diesel prices have increased by up to 70%, depending on the region. Countries with low energy taxes, such as the U.S., are affected more severely than countries with high taxes, such as Germany. Fuel typically accounts for 30 to 50 percent of operating costs in land transport, significantly more than in ocean freight, so the impact is disproportionately greater there.
What types of surcharge mechanisms are available?
New ocean freight contracts are usually quoted using the Bunker Adjustment Factor (BAF). In light of market volatility, shipping lines continue to impose emergency bunker surcharges rather than switching entirely to a fixed quarterly BAF. There are essentially three approaches:
- Return to the regular quarterly BAF, which is equal to the previous BAF plus Emergency Bunker Surcharges, or a higher amount.
- Frozen previous BAF plus continuous Emergency Bunker Surcharges.
- Monthly bunker adjustment without Emergency Bunker Surcharges. Many shippers have already switched to this model.
Surcharges for land transport will remain in effect due to rising oil prices.
Would you like to see the complete figures for your shipping region?
DHL’s monthly Ocean Freight Market Update includes detailed analyses of demand, capacity, rates, and schedule adherence.
What can we expect in Q4 2026?
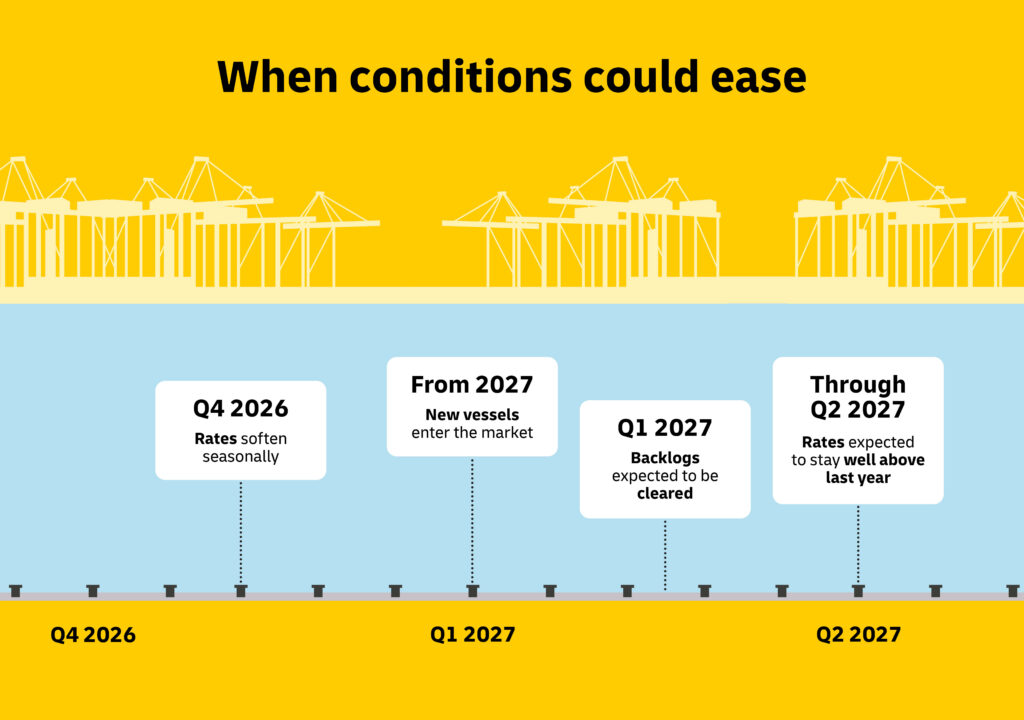
The intensity of the peak season is subsiding, and rates are expected to ease as volumes decline seasonally. However, this does not imply a return to last year’s levels: Rates have more than tripled since October 2025, and levels significantly above last year’s are expected for the coming months – likely extending into the first and second quarters of 2027. This is the key framework condition for the upcoming tender season.
Three factors make it unlikely that tensions will be alleviated:
- The gridlocks are clearing slowly. It takes four to six months to clear the backlog, and by then, the next surge in volume will have already begun.
- New capacity will not take effect until 2027, and even then, land-side infrastructure will remain the limiting factor.
- Oil prices remain high. As long as the situation around the Strait of Hormuz remains unchanged, bunker and hinterland surcharges will remain volatile.
The Suez Canal is the most significant variable in both directions. If shipping companies continue to increase their use of the route, transit times will decrease and effective capacity will return to the market. In the short term, however, schedule changes and overlapping arrivals could strain the reliability of Asia-Europe routes.
How should you plan for the fourth quarter?
Seven specific conclusions can be drawn from the trends observed in Q3:
- Do not wait for rates to Europe to fall further. An upward trend reversal is expected on the Far East-Europe route in the fourth quarter.
- Explore alternative options. Using a different regional gateway that aligns with your inland transport options can help you avoid congestion at local terminals and in hinterlands. Even if it incurs additional costs, booking with a different shipping line may also be advisable.
- Expand your buffers and contingency plans. Currently, ships are arriving unpredictably – many too late and some too early. Reducing backlogs will last into Q1 of 2027, coinciding with the next surge in volume.
- Include alternatives in contracts. Rather than negotiating them after a disruption occurs, rate cards and transport agreements should provide for alternative options from the outset.
- Treat Suez routes as an option, not the basis for planning. Route selection may change at short notice and without prior announcement, even during the trip.
- Check insurance coverage for shipments through the Red Sea. Pay particular attention to coverage for rerouting and general average.
- Choose a surcharge mechanism actively. The choice between a regular quarterly BAF, a frozen BAF with emergency bunker surcharges, and monthly adjustments significantly impacts costs.
Conclusion: What lessons can we learn from the third quarter?
The third quarter of 2026 revealed just how sensitive the global ocean freight network is to regional disruptions. Just a few weeks of typhoons in China drove port gridlocks back to 2022 levels and pushed global schedule adherence to its lowest point in four years.
The shift in the source of bottlenecks is more decisive than the peak season. The bottleneck no longer primarily lies in available vessel capacity, but rather in ports, terminals, and hinterland connections. Adding more ships will not solve this problem, so the relief starting in 2027 will be less significant than suggested by the access figures.
For the fourth quarter, this means longer lead times and requires more buffer time as well as a deliberate choice regarding the surcharge mechanism. Please contact us if you’d like to review your shipments before the end of the year.
FAQs on the Ocean Freight Market Update
How did ocean freight rates develop in Q3 2026?
In September 2026, the Shanghai Containerized Freight Index was 231% higher than in the same month the previous year and 44% higher than in June. A decline is expected in the fourth quarter as seasonal volumes decrease; however, rates are likely to remain significantly higher than last year’s levels until 2027.
Why was schedule adherence so poor in Q3?
Schedule adherence dropped to its lowest level since 2022. In Asia, fewer than one in three ships arrived on time; globally, the figure was fewer than one in two. Several typhoons forced the closure of key Chinese ports for several days at a time during July and August, causing this downturn. It is expected to take four to six months to clear the resulting backlogs.
How many ships pass through the Suez Canal now?
Around 30% of major east-west trade volumes are again being routed through the Suez Canal, up from 3% in February 2026. For Asia-Europe services, this share is 37% in the head-haul direction and 50% in the back-haul direction. However, route selection remains an operational decision made by the shipping companies and is subject to change on short notice.
Why is fleet growth not helping to alleviate the capacity shortage?
Although the global fleet is expected to grow by approximately 4% in 2026, effective usable capacity will remain nearly 20% below nominal levels due to port gridlocks, diversions around Africa, and laid-up tonnage. Significant fleet growth is not expected until 2027. Even then, land-side infrastructure will continue to be the limiting factor.
How much have fuel costs gone up?
The price of Very Low Sulphur Fuel Oil has increased by 58% since the end of February 2026. Depending on the region, diesel prices in hinterland transport have risen by up to 70% since December 2025. Since fuel accounts for 30% to 50% of operating costs in this sector, these price increases have a significant impact on pre- and post-carriage operations.